Gaming Consoles comparisons
Console generations last seven years or more, so picking the right one matters. We compare GPU power in teraflops, storage, maximum resolution and frame rate, disc drive, portability, weight and launch price across PlayStation, Xbox, Nintendo and Steam Deck.
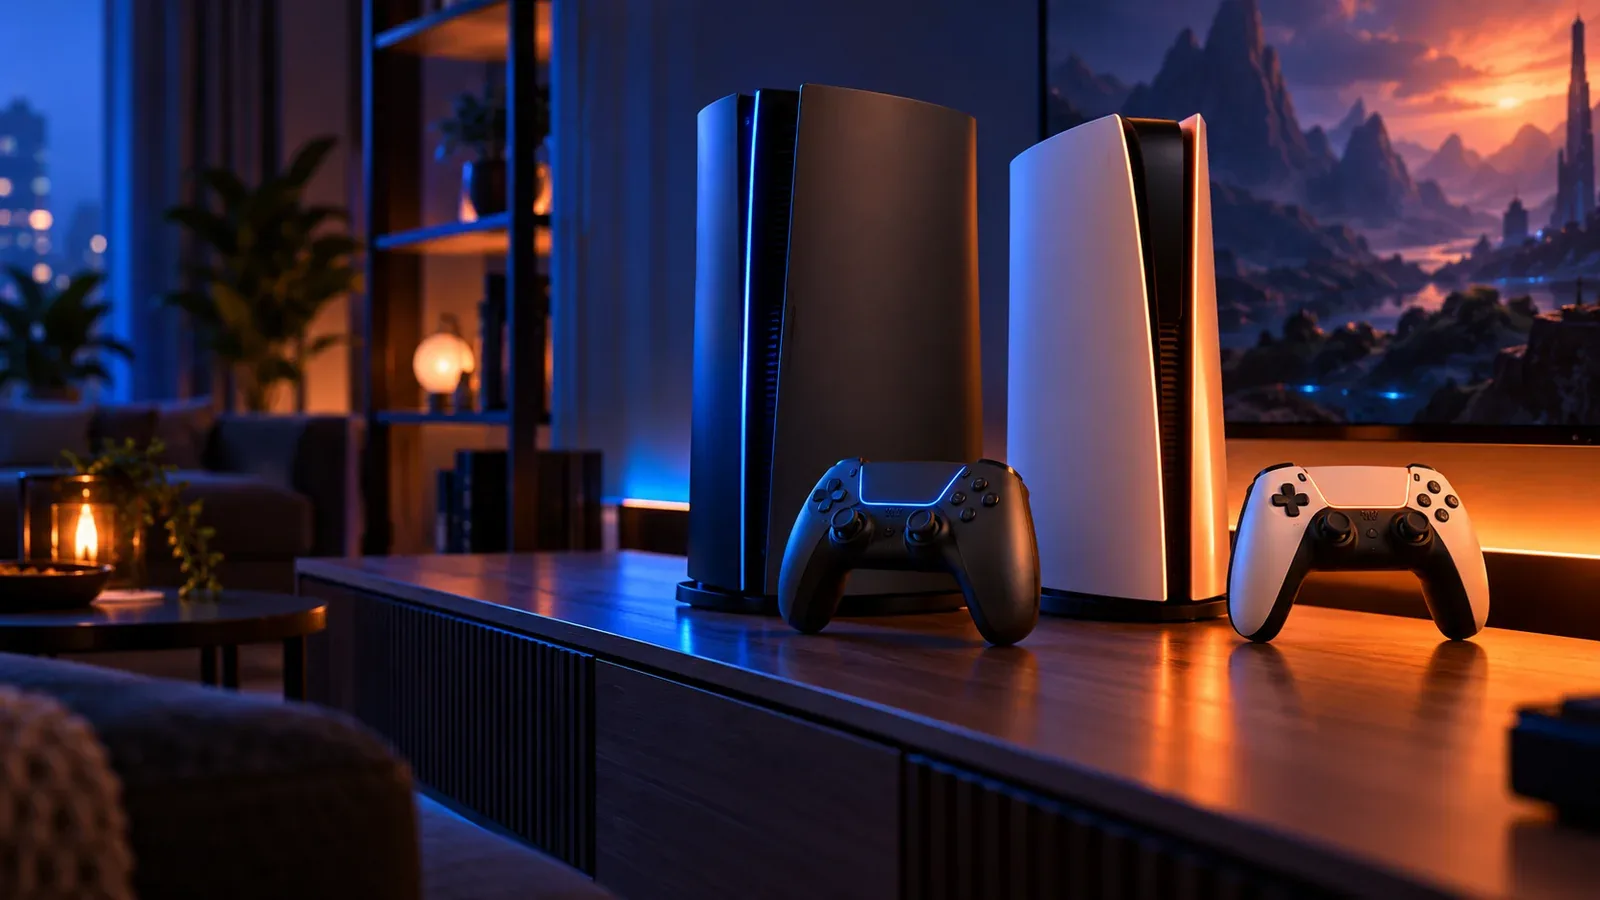
Popular console comparisons
Gaming consoles in our database, ranked by VersusAnything Score
- Microsoft Xbox Series S62/100The Xbox Series S is the smallest, cheapest current-gen console, targeting 1440p rather than 4K but running every Series X game.
- Sony PlayStation 5 Digital Edition61/100The PS5 Digital Edition is the same console without a disc drive, saving money if you only buy games from the PlayStation Store.
- Sony PlayStation 5 Pro53/100The PS5 Pro upgrades the GPU by around 45 percent, adds AI-driven PSSR upscaling and doubles storage to 2 TB for the most demanding 4K players.
- Nintendo Switch 249/100The Nintendo Switch 2 is a far more powerful hybrid with a 7.9-inch 120 Hz screen, 4K docked output, magnetic Joy-Con 2 controllers and GameChat.
- Sony PlayStation 548/100The PlayStation 5 is the best-selling console of this generation, with a fast custom SSD, DualSense haptic controller and the largest exclusive line-up.
- Microsoft Xbox Series X48/100The Xbox Series X is Microsoft's 12-teraflop flagship with Quick Resume, broad backwards compatibility and day-one Game Pass access.
- Valve Steam Deck OLED29/100The Steam Deck OLED is a handheld PC that plays your existing Steam library on a 7.4-inch HDR OLED screen with better battery than the original.
Compare any two gaming consoles
Pick two products from this category; if we have a published comparison it opens directly, otherwise the comparison tool loads both spec sheets.
How we score gaming consoles
Every console is scored on the same rows: GPU power, CPU, max output, storage, disc drive, portable, weight, key exclusives, price (USD, 2025 list). Measurable rows are normalised across the category and weighted (Performance 35%, Storage 15%, Portability 10%, Value 40%); rows without a sensible direction are explained, not scored. Full rules on our how we score page.